
Overview

Quality Large Cap
Get exposure to a collection of large, well-established companies known for their financial stability, reliability and long history of growth.

Multi-Themed
Emphasis on high conviction global themes and sectors with an emphasis on the US.

Actively Managed
The strategy chooses the most promising sectors based on their combined momentum and macro-economic signals.
Holdings
| Name | Ticker | Weight |
|---|---|---|
| Cash | ERNS | 0.1% |
| ISHARES UK GILTS 0-5YR UCITS | IGLS | 6.05% |
| ISHARES MSCI WD ENERGY-USD D | WENS | 4.26% |
| VANECK DEFENSE ETF | DFNG | 3.83% |
| AM US INFLN EXP 10Y-ETF ACC | INFG | 4.69% |
| L&G LONG DATED ALL COMMOD | CMFP | 5.67% |
| AM EURO INFL EXP 2-10Y-ETF A | INFL | 4.59% |
| ISHARES USD TIPS 0-5 | TP05 | 4.12% |
| Global X Data Center REITs & Digital Infrastructure UCITS ETF (Acc) | VPNG | 2.54% |
| WisdomTree Quantum Computing UCITS ETF - USD Acc | QWTM | 1.99% |
| Avantis Global Equity UCITS ETF Acc | AVCG | 12.92% |
| iShares MSCI EM UCITS ETF USD (Dist) | IEEM | 9.32% |
| iShares S&P 500 UCITS ETF USD (Dist) | IUSA | 6.31% |
| iShares ? Corp Bond 0-5yr UCITS ETF GBP (Dist) | IS15 | 5.99% |
| XTrackers MSCI World Information Technology UCITS ETF 1C | XXTW | 4.71% |
| Invesco Nasdaq-100 UCITS ETF | EQQQ | 4.03% |
| XTrackers Nikkei 225 UCITS ETF 1D | XDJP | 3.42% |
| iShares Global Clean Energy Transition UCITS ETF (Dist) | INRG | 2.78% |
| VANECK SEMICONDUCTOR ETF | SMGB | 2.65% |
| VANG USDEMGVB USDD | VEMT | 2.91% |
Performance
Backtest data of Vanilla Trading Co. reflects hypothetical performance based on the movement of its constituents (source: Yahoo Finance) and using their respective target weights and rebalancing methodology, starting on 8 Dec 2017 and ending on 25 Mar 2024. These data demonstrate simulated past performance and are marked with LIGHT GOLD while actual performance data are in DARKER GOLD. Past performance is not a reliable indicator of future performance. The investment return and principal value of an investment will fluctuate so that an investor’s securities, when sold or redeemed, may be worth more or less than their original cost and current performance may be lower or higher than the performance quoted. Changes in exchange rates may cause your investment to go up or down in value. The information shown does not take into account any fees or commissions.
Listing & Tickers
| Country | Exchange | Base Currency | Trading Currency | Exchange Code | ISIN | SEDOL | BBG Ticker | RIC | WKN | Listing Date |
|---|---|---|---|---|---|---|---|---|---|---|
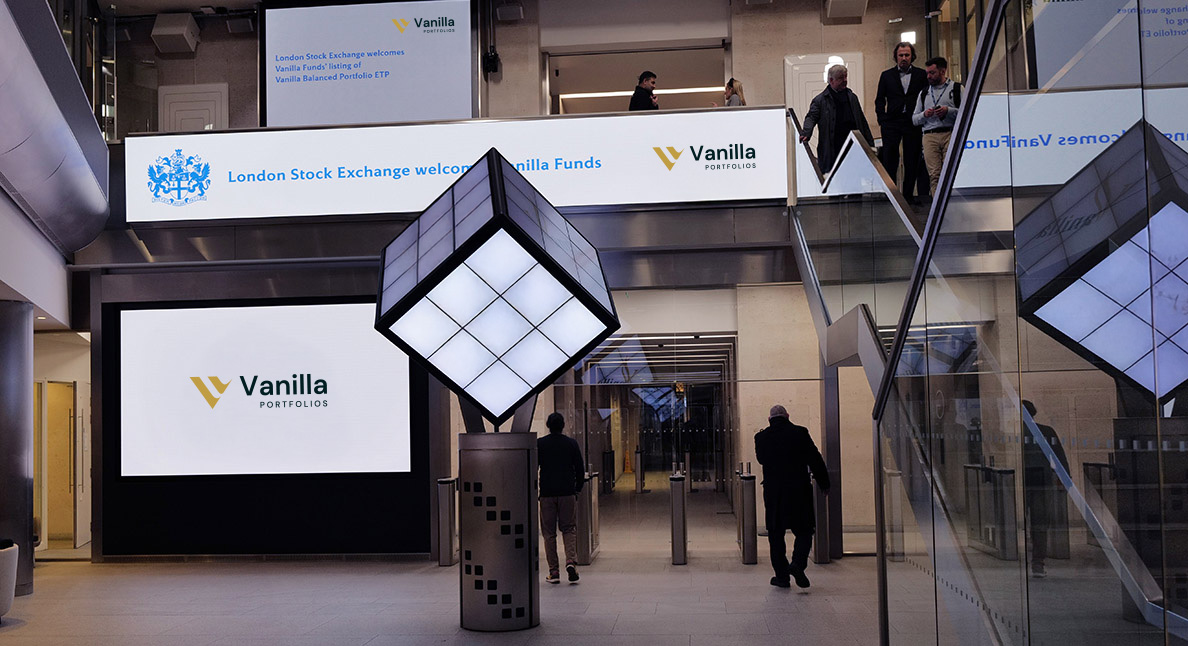
| UK | London Stock Exchange | GBP | USD | VPBU | XS2944878912 | BR54FM2 | VPBU LN | VPBU.L | N/A | 5th December 2024 |
| UK | London Stock Exchange | GBP | GBP | VPBG | XS2944878912 | BR54FN3 | VPBG LN | VPBG.L | N/A | 5th December 2024 |
Structure
- StructureETP
- DomicileIreland
- Replication MethodPhysical
- DividendsNo
- Physical AssetsYes
- Underlying AssetsBASKET
Document Downloads
-
Vanilla Portfolio GBP Global Balanced 30/11/2024
-
Vanilla Portfolio GBP Global Balanced SP 30/11/2024
-
Vpbg factsheet 23/10/2026